
Profitable Trading Strategy: Master the Volatility Contraction Pattern (VCP)
- Feb 11, 2025
- 4 min read
Updated: Jan 2
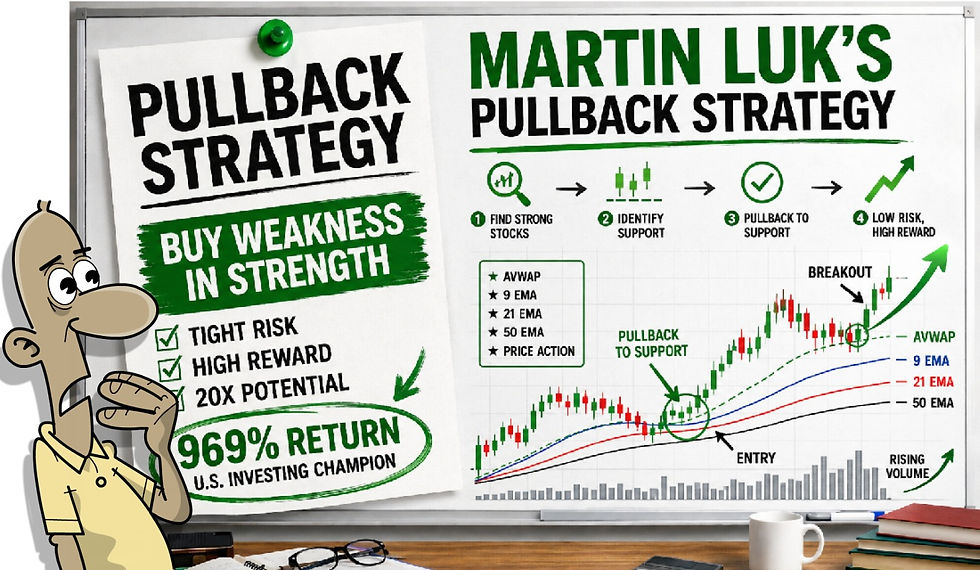
Mark Minervini's trading method
One of the biggest challenges traders face isn’t finding stocks that move — it’s finding stocks that are about to move.
The Volatility Contraction Pattern (VCP) solves that problem.
Popularised by Mark Minervini, the VCP is a price-based structure that identifies periods where volatility tightens, selling pressure dries up, and institutions quietly accumulate shares before a powerful breakout. When executed correctly, it offers exceptional reward-to-risk opportunities with clearly defined invalidation points.
In this guide, we’ll break down exactly how the VCP works, why it’s so effective, and how to trade it with discipline.

What Is the Volatility Contraction Pattern?
At its core, the VCP describes a stock that:
Has already made a meaningful advance
Enters a series of tighter consolidations
Shows progressively lower volatility
Breaks out once supply is exhausted
Rather than chasing momentum, the VCP allows traders to position early, close to support, before demand overwhelms supply.
This is not a prediction-based strategy. It’s a probability-based structure grounded in observable market behaviour.

Why Volatility Contraction Matters
Markets move because of imbalances between supply and demand.
During a VCP:
Sellers become less aggressive
Pullbacks become shallower
Volume contracts on declines
Buyers quietly absorb shares
Each contraction represents a failed attempt by sellers to push price lower. By the time the stock reaches its final contraction, very little supply remains — setting the stage for a breakout.

This is why VCPs often lead to explosive moves, particularly in strong market environments.
The Anatomy of a Proper VCP
Not every tight base is a VCP. High-quality patterns share several defining characteristics.

1. Prior Uptrend
A VCP must form after a strong advance. This ensures institutions already have interest in the stock.
Flat or declining stocks rarely produce meaningful VCP breakouts.
2. Multiple Contractions
The pattern typically forms 2–5 contractions, each one:
Smaller than the previous
Tighter in price range
Less volatile
This visual tightening is critical. It signals diminishing selling pressure.
Popular cup handle pattern demonstrating reduced volatility at the breakout:

3. Volume Dry-Up
Volume should:
Decline during contractions
Spike only on breakout
Low volume during the base suggests sellers are no longer motivated. This is one of the most important confirming signals.
4. Rising Support
The lows of each contraction often rise, showing buyers stepping in earlier each time.
This creates upward pressure beneath price, even while the stock appears to be “doing nothing.”
5. Tight Risk Definition
One of the greatest strengths of the VCP is risk clarity.
Stops are typically placed:
Below the lowest point of the final contraction
Or below rising support / key moving averages
This allows for asymmetric reward-to-risk trades.

The Ideal Breakout
A valid VCP breakout usually includes:
A decisive move through resistance
A clear increase in volume
Broad market support
Breakouts that occur on low volume or in weak markets are more prone to failure.
Why Institutions Love VCPs
Institutions cannot buy large positions in one go. Doing so would drive price against them.
Instead, they:
Accumulate during low-volatility consolidations
Absorb shares patiently
Push price higher only when supply is exhausted
The VCP reflects this behaviour directly on the chart.
That’s why many of the market’s biggest winners — across decades — show clear VCP structures before their largest advances.

Common VCP Mistakes to Avoid
Even strong patterns fail when traders make basic errors.
Forcing the Pattern
Not every base is a VCP. If contractions aren’t clearly tightening, skip it.
Ignoring Volume
Price without volume context is incomplete information.
Buying Too Early
Entering before the final contraction completes often leads to unnecessary drawdowns.
Oversizing
Even high-quality setups fail. Risk management is non-negotiable.
Combining VCP With Quality & Momentum
The VCP works best when aligned with strong fundamentals and relative strength.
This is why we:
Filter for quality stocks
Focus on leading names
Scan for tight consolidations with momentum
FW Stock scanner identifies reduced volatility contractions:

By stacking quality + momentum + structure, probability shifts meaningfully in your favour.
This is also why we built our bespoke breakout scanner — to systematically surface VCP-style setups without hours of manual charting.
Risk Management Comes First
No pattern guarantees success.
A professional approach means:
Predefined stop placement
Fixed percentage risk per trade
Accepting losses quickly
Letting winners work
Most traders fail not because of poor setups, but because of poor execution.

Final Thoughts
The Volatility Contraction Pattern is not a shortcut — it’s a framework.
It rewards:
Patience over prediction
Discipline over excitement
Structure over noise
When applied consistently, in the right market conditions, it can form the backbone of a repeatable, professional trading approach.
If you want to go deeper:
You can download my Free trading PDF

Explore the Breakout scanner
Or join the community where I share my trades, portfolio management, and execution logic in real time

Key Takeaways
VCPs identify institutional accumulation
Volatility contraction precedes expansion
Multiple tightening contractions are essential
Volume confirms supply exhaustion
Risk must always be defined first
My Brokerage Account (Interactive Brokers) - Low cost trading broker
My Breakout Scanner - Find stocks contracting and breaking out
My FREE Strategy Blueprint - https://www.financialwisdomtv.com/service

Comments