
MAXIMUM TRADING GAINS - Using Price, Time & Volume VWAP
- Mar 2, 2024
- 15 min read
Updated: Jan 11
A proven stock trading Indicator - Anchored VWAP
Hi all, its been a while since we did a book review, so In today’s video we look at the book “Maximum Trading Gains with Anchored V-WAP ” by Brian Shannon.
Brian Shannon is the founder of alphatrends. net, an online swing trading education community. He is a full-time trader and educator and has also authored the highly regarded book - Technical Analysis Using Multiple Timeframes. In his 30 years of trading at investment firms like Lehman Brothers, Brian has gained exhaustive insight into market dynamics and the human factors that drive them.

Brian started trading markets when he was a teenager with $500, earned by delivering newspapers, his father then provided a further $4500 to bolster his starting balance. The first stock he bought doubled in 3 months, which kindled his desire to become a stock broker.

Brian came across V-WAP when he was heading the proprietary trading department of Marketwise Securities. The charting platforms did not have the AV-WAP functionality back then, so he got the tool custom-made by the trading platform TC2000. The “point-and-click” V-WAP feature was then called “Anchored V-WAP by Alphatrends”.
Now, let’s dig deeper into V-WAP and it’s benefits, and if you do find value please consider subscribing and discover our library of stock trading videos and resources.
The volume-weighted average price or V-WAP is the cumulative average price of a stock traded during the day or any other period you choose on the chart. The V-WAP is more responsive to volume as it is volume-weighted by definition. So for example, if there are five trades in a day at prices 10, 11, 11.5, 12, and 12.5, with volumes of 1000, 500, 700, 900, and 10,000 shares, the volume weighted average price would be 12.16, which is quite skewed towards the high price of the day, as most volume action happened at the highest price. Therefore, for V-WAP, volume is the most important element that shapes the indicator on the chart.

The Anchored V-WAP or A-V-WAP is the same as V-WAP except that the starting point or the anchor for V-WAP is set by the user at a specific meaningful point; that is, it’s not simply the start of the trading day. The benefit of anchoring the V-WAP at a specific point is that the V-WAP then sheds the baggage of previous data points and focuses on the most important point in the price action to calculate and plot the V-WAP.

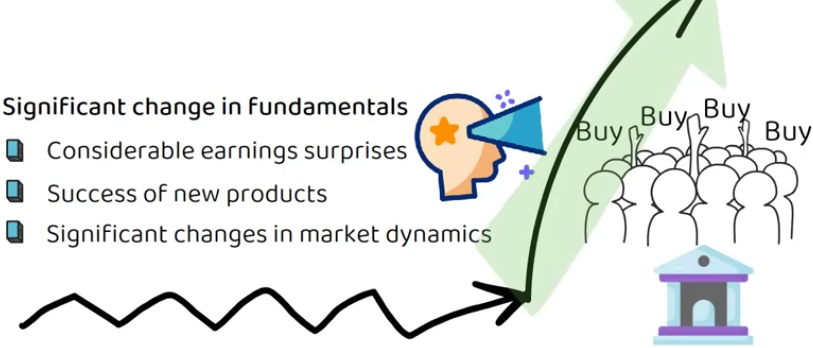
For example, assume you are a trend trader focused on capturing massive uptrends in stocks that have seen significant changes in fundamentals. Changes in fundamentals, like; considerable earnings surprises, the success of new products, or significant changes in market dynamics, lead to a price action that is entirely different than the stock’s previous price action.
The changed perception of the stock attracts market participants including large institutions who are willing to jump in to defend the price and keep the trend intact. A stock in a long period of limbo can spring back to life and start a marathon move on such changes, and when such a thing happens, as a trend trader, you would want to anchor your indicator at the start of the trend, which becomes an important point for all market participants. Anchored V-WAP allows you to do exactly that by letting you choose a desired starting point.
In Brian’s words, “the A-V-WAP broadcasts the message of the market, that is whether sellers or buyers are driving the then-current price trend more clearly than any other technical tool”.
The most important components of V-WAP or A-V-WAP are price, volume, and time. While price is straightforward, we must dwell a little deeper into the volume and time component.

Volume is the heavyweight in the A-V-WAP formula. Most volumes in stocks are done by institutions and it pays to observe these institutions. If a new trend is attracting significant volumes, it will lead to a slope in V-WAP and different institutions with varying motives will impact the price.
For example, in a downtrend, an institution looking to offload a long position will sell as the price comes above the downward-sloping V-WAP, and a short seller might increase the position as the price approaches the V-WAP, assuming that the downtrend will continue. Both these volume actions will lead to a continuation of the downtrend. On the other hand, if this downtrend isn’t supported by strong volumes, the V-WAP wouldn’t give clear signals due to a lack of institutional action.
At any given point in time, the interpretation of a trend can vary depending on the lens you are applying. A zoomed-out view on this chart shows that the price is in a long-term uptrend, making higher highs and higher lows. However, when we zoom in to shorter timeframes, it appears to be in a downtrend with lower lows and lower highs.

While planning a short-term trade on this chart you can wrongly short the stock if the downtrend continues. However, when you have that big picture of uptrend in mind, you would take a more nuanced approach for your trade and that’s where the time component of A-V-WAP helps.
Brian’s nuanced approach using AV-WAP is to start with the long-term timeframe to determine the overall money flows; then move to the intermediate term to plan the trade and finally consult the short-term chart to fine-tune the entry and exits. A swing trader's long-term could be months and years, intermediate term could be weeks and days and short term could be hours and minutes.
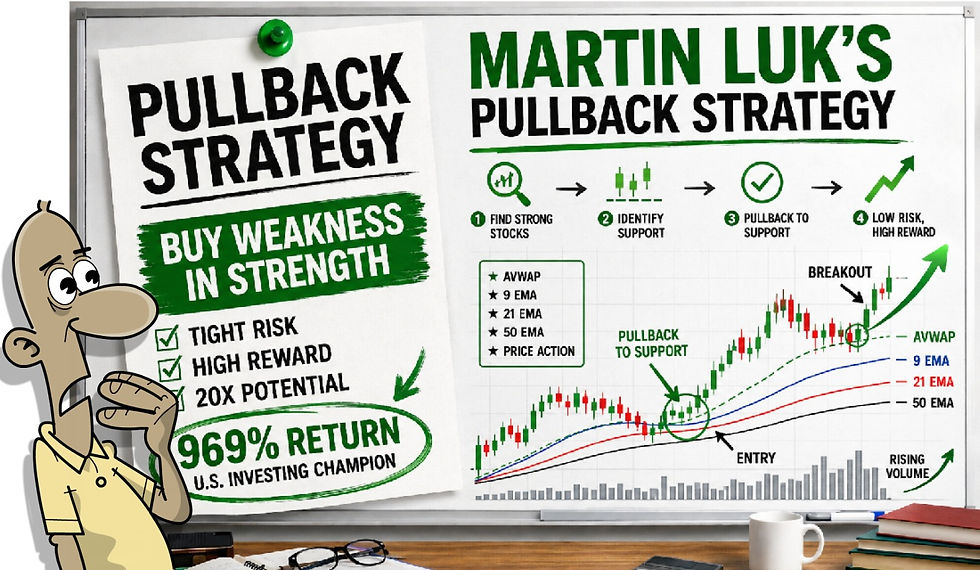
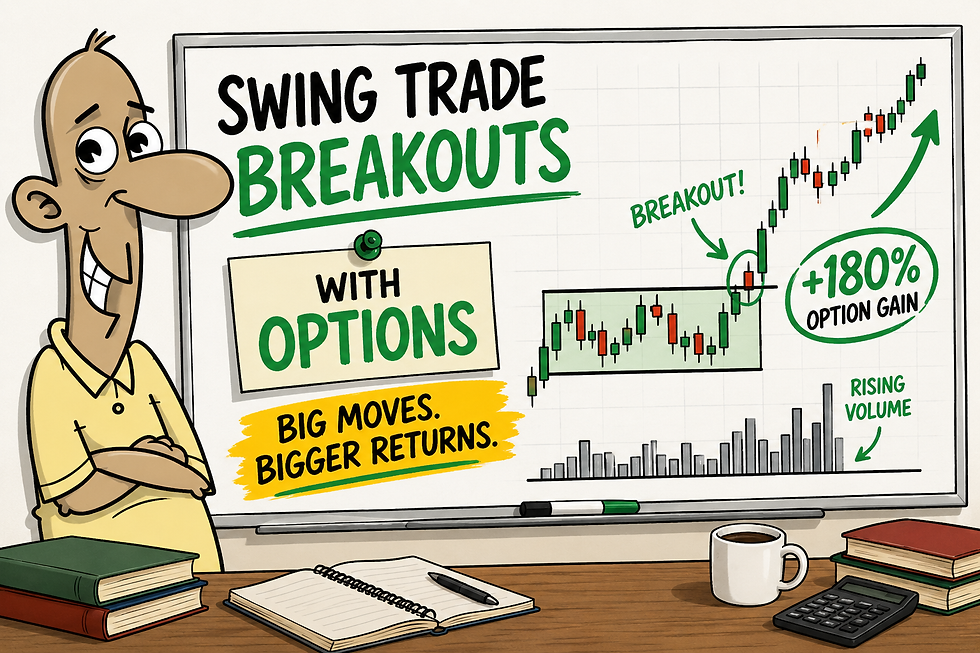
Brian’s philosophy is similar to ours, we want to see upward longer-term direction and only then hone in on a specific technical entry point, hence why we built a bespoke breakout scanner.

Let’s now get to the meat of the topic - how to use AV-WAP for trading
A-V-WAP is an effective dynamic analysis tool for better stock selection, timing entries, risk management, and exit techniques.
At the outset let’s lay the ground rules while using the AV-WAP
V-WAP is used for trading trends, and it can give confusing signals in choppy and volatile markets
To determine the trend in our analysis we use the Dow theory and the slope of V-WAP line. A stock would be in an uptrend if it’s making higher highs and higher lows with an upward-sloping V-WAP line. It will be in a downtrend if it’s making lower highs and lower lows with a downward-sloping V-WAP line.

As a discipline and risk management practice, we enter each trade with a stop loss, which is determined before entering the trade, and is then trailed based on the price action.
With the rules set, let’s see the first use of AV-WAP, which is “finding hidden support and resistance in the price”.
Most conventional support and resistance zones are identified by studying previous price patterns. If the price has bounced from a level a few times we take it as a support zone and if the price has fallen a few times from a level, we take it as a resistance level. Brian calls these zones levels of interest.

Unlike the more common support and resistance levels which are seen as horizontal price consolidations, the support and resistance levels of AV-WAP are dynamic. They adjust with each trade.
The V-WAP and AV-WAP can reveal important levels of buyer and seller interest which do not show in any other analysis method. These levels are even more important in trending prices as fast-moving prices hardly throw any levels which can be credibly termed as support or resistance levels.
For example, in this chart of Apple Inc., the anchored V-WAP on the top acted as resistance multiple times, and as the price pierced the resistance, the same A-V-WAP started acting as the support as the trend changed.

Here is another chart of Tesla with an A-V-WAP anchored at the bottom of the move. The price took support at multiple levels near the AV-WAP and continued higher, doubling from the bottom.

Another important factor to notice is the slope of the AV-WAP curve. The steeper the A-V-WAP, the more aggressive the trend suggesting full control of buyers and the higher the likelihood that V-WAP will act as support in an uptrend and the price will bounce back. The reverse happens in a downtrend when AV-WAP becomes a strong resistance and sellers are in control. Brian terms the price above the upward-sloping AV-WAP as “innocent until proven guilty” and prices below the AV-WAP are “guilty until proven innocent”.
A flat V-WAP represents neutral periods.

The first one or two touches on AV-WAP anchored to an important point are more likely to see strong moves. Also, the more times AV-WAP support or resistance is tested, the more likely it is to fail.
Finally, these supports and resistances are levels of interest until they are confirmed by subsequent price action. Therefore, the best trading strategy isn’t to buy as the price approaches/touches AV-WAP in a dip but after the price sees some strength after the dip. Similarly, the short trades should be placed as the stock rejects the AV-WAP and displays weakness after a bounce. The stop in a long trade would be placed at the low of the dip and in a short trade would go at the high of the bounce.
There are also times when the same V-WAP line flips from being support to being resistance and vice versa. In this transition, the price experiences consolidation and relative stability when it crisscrosses the V-WAP while changing the trend. Once the trend changes, the same V-WAP becomes resistance.
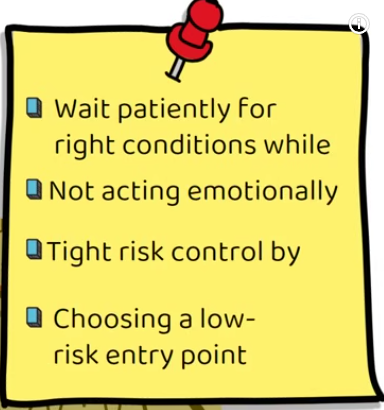
The key to trading support and resistances is to wait patiently for the right condition and not act emotionally while keeping tight control on risk, by entering at a low-risk point.
Let’s now discuss on the subjective part of the strategy - where to set the anchor.
The goal of setting the anchor rightly is to objectively measure the demand and supply and gain an edge in our buying and selling decisions.
Here is a short list of all places where you can set AV-WAP anchors.
At High Volume Events - Volumes more than 1.5x normal
At measurable fundamental events like earnings or fed announcement
At measurable price-based events like swing highs and lows
At IPO price

Let’s take a look at anchors placed at high volume events. A high-volume period with a significant price move signifies a big perception change about the stock. The AV-WAP anchored at these points is defended strongly by strong hands.
For example, in this chart of Zoom Inc. the AV-WAP is anchored at a big up day on high volume. You can see how the price took support at this AV-WAP multiple times and continued its journey higher. The stock went on to become a six-bagger from the close at the anchor day, giving multiple opportunities for AV-WAP traders to enter.

Regarding fundamental event anchor points, several events can bring a positive or negative change in perception. These events could be earnings releases, regulatory announcements, or other sector or company news that can change the business trajectory.
For example, here is the chart of one of the best midcap performers in 2023 on NASQDAQ - Duolingo Inc. The stock gapped up on earnings in March 2023 with high volumes. The AV-WAP anchored at that point was tested five times in the move and stock drove right back into a new ground each time. The stock ended up delivering a 170% return from the earnings day with multiple opportunities to enter.

Regarding price-based event anchors, the most popular of which are swing highs and lows. Though these highs and lows are known with a lag, they are still quite effective in trading using AV-WAP. We will discuss the price-based anchors in much greater detail later in the video.
Brian also talks about two variations of AV-WAP for better trading outcomes - Handoff and Pinch
Starting with the handoff, it’s normal for the rate of change in a trend to slow down or speed up. When it speeds up, momentum is handed off from one V-WAP to another and provides a new anchor point to catch the fast trend. Like in this chart, we have anchored the first AV-WAP to the swing low and anchored another handoff AV-WAP at the point price took support at the first AV-WAP. We place the new anchor when a trend begins to accelerate after the original AV-WAP was touched or nearly touched. This point is called the handoff point - a term coined by Brian.

We keep the original AV-WAP on the chart and keep changing the colors of each successive handoff for clarity, as the price will often take support from the original AV-WAP. In this case, the price continued to display strength for the next eight months, delivering handoffs until a pullback in August to the lower AV-WAP.
Each successive handoff offers a momentum layer on the chart that can be traded as soon as the price shows strength after touching the AV-WAP. The same technique can be applied in short selling as can be seen in this chart.

Each layer of downward momentum could have been traded by entering at the green dots with stop losses at the recent swing high.
In a Pinch, we identify a key swing high level and a key swing low level to create a consolidation area and trade the price break from this area. The pinch, which can be traded on all timeframes, is a kind of consolidation that Mark Minervini refers to as a volatility contraction Pattern or VCP, which can be seen in a previous video of ours.
In this chart, the stock is compressed between two AV-WAPs as the energy builds. The red AV-WAP represents the dominant long-term trend and the green AV-WAP is anchored to the recent swing low, representing a countertrend within the dominant trend. As the stock ping-ponged between the two AV-WAPs and broke the green V-WAP to continue in the direction of the long-term trend, it could have been shorted at the black circle, with the stop loss at the recent swing high.

While a pinch can be a great setup to trade in the direction of the dominant trend, we must not preempt trading the pinch because not all of them are resolved in the direction of the dominant trend. Sometimes a pinch can be resolved in the opposite direction resulting in the end of the dominant trend, like in the chart here.

Preempting entry or entering before the actual break of AV-WAP, could lead to unnecessary losses that must be avoided in trading.
It’s vital to understand the psychology of the pinch - which is mainly a tug of war between the bulls and the bears. It’s best to be an onlooker during that war and get involved only when the victor is clear. Irrespective of your confidence in the trend, you must always go in the trade with a pre-determined stop loss for risk management, something we always preach on this channel.
For short-term traders, Brian suggests using multi-day AV-WAP to board a momentum bus if they missed the first, second, or third day of action. If you miss a big move on a stock on day 1, you get an opportunity and to get in the next day when the stock briefly tests the AV-WAP anchored at the first candle of the day. For this, you have to refer to the intraday chart going down to 1 to 10 minutes.

For example, this 2-minute chart shows a 33% move in three days in a stock. If you missed the stock the first day and still want to get in, the AV-WAP anchored to the first candle of the second day would have allowed you to enter when the price came rocketing back after the brief cut on the AV-WAP. The same pattern was repeated on day 3 as can be seen here.
It’s quite amazing how this pattern gets repeated in many stocks in uptrends as well as downtrends. The strategy also helps you get into stocks if you have missed the breakout on the first day. This way you can enter the momentum while keeping a tab on your losses, as the stop loss would be placed nearby at the low of the day.
The same principles can be applied to trade gaps on multiple timeframes. Now there could be three important types of gaps - Breakaway Gaps, Continuation Gaps, and Exhaustion Gap. Let’s see and analyze them all in this chart.

A breakaway gap happens when the stock breaks free from a longer-term consolidation. An AV-WAP anchored at the first candle of the breakaway gap gets tested at the initial bout of supply, which gives an opportunity to enter as the price reclaims the V-WAP in strength.
A continuation gap happens mid-move and signifies the acceleration of the trend. Here too an AV-WAP anchored at the gap-up candle would have given an entry opportunity as the price fell below and reclaimed the AV-WAP.
The last gap was the exhaustion gap that led to pent-up selling as traders who made large returns came to book their high profits.
There could be more continuation gaps in the same move. Therefore it’s hard to figure out which gap is the exhaustion gap, which is why it’s essential to follow a stop-loss discipline to get out of the trade if a gap fails to follow though.
V-WAP can also be helpful in trading IPO stocks, providing better entry points post listing of the stock. In IPO stocks, to get the best entry, it’s prudent to observe the stock in intraday timeframes of 1 to 10 minutes and anchor the AV-WAP to the second candle and not the first, because there would be exceptionally large emphasis on the lower first few minutes price because of very high volumes traded in initial minutes.

For example, in this chart, AV-WAP anchored to the first minute did not give a reliable entry point. However, as we moved the anchor to the second minute, there were two times when the price bounced off the V-WAP giving low-risk entries near green dots. When you are trading the IPO the day after listing, it’s no longer necessary to anchor to the second candle as the divisor increases.
For traders with a longer time horizon, the IPO AV-WAP also works well. For example, in this six-month chart, constructed with a 195-minute candle, the AV-WAP got tested early, giving a great entry point.
Let’s now look at how AV-WAP can provide the best entry points in a trade in comparison to trading the dips and bounces, or breakouts of breakdowns.

In this chart, the primary dominant trend is a downtrend, as the price is making lower lows and lower highs. To enter a short trade, a trader can short in the bounce, anywhere in the red-shaded area or areas labeled A. However, this would be more of a guessing game as you would not know how high the bounce would be before the price breaks down, or break down at all. Also, there isn’t a safe area to put the stop loss as the price trajectory is uncertain.
The second entry could be the breakdown as price breaks the previous low, which is entry C on the chart. At this point, the price would have already made a significant move and there are good chances of momentum slowing as the price moves further down. Also, the stop losses in this case would be placed at the swing high, which might make it a high-risk trade.
The third entry could be at the green dots or entry B when the reversal of bounce is confirmed by the AV-WAP, when the price closes below the AV-WAP. This would help you get earlier into the short trade whilst offering a low-risk entry point, due to the stop loss at the high of the bounce being closer by.

Brian Shannon has dedicated his trading to AV-WAP - and it’s amazing how this simple indicator is so powerful for all aspects of trading. In the book, Brian discusses these topics in much more detail including the psychology of market participants at different times, which is a must-know for any stock trader.
As Bruce Lee once said, “I fear not the man who has practiced 10,000 kicks once, but I fear the man who has practiced one kick 10,000 times”. If you want to attain that kind of mastery and succeed in trading using AV-WAP, Brian’s book is a great read. If you are new to trading and looking for a simple yet powerful strategy to start, you can grab Brian’s book and build your own strategy upon it.
For those interested, we have a highly engaged group that uses our bespoke breakout scanner to find some of the best trades, offering low-risk high reward potential. Feel free to use the links below.
Access our group for more - https://www.financialwisdomtv.com/service
8 Key FAQs — Anchored VWAP
1) What is Anchored VWAP (AVWAP) and how is it different from VWAP?
VWAP is the volume-weighted average price over a set period (often the day).
Anchored VWAP starts from a specific user-chosen point (earnings gap, swing low, major volume day, IPO open, etc.) so it reflects the average cost basis from that event onward, not from the session open.
2) Why do traders use AVWAP instead of traditional support and resistance?
Traditional support/resistance is often static and based on past horizontal levels. AVWAP creates dynamic support/resistance that updates with price/volume over time, often revealing “levels of interest” that aren’t obvious on a chart—especially in fast trends where clean horizontal levels don’t form.
3) Where are the best places to anchor AVWAP?
High-quality anchors usually come from events that change perception and attract institutions, such as:
Earnings gaps / major news
High-volume days (e.g., 1.5× normal volume)
Swing highs/lows (trend inflection points)
Breakaway/continuation gaps
IPO day (often anchored from the 2nd candle intraday)
4) How do I confirm trend direction using AVWAP?
AVWAP works best in trends. A practical filter is:
Uptrend: higher highs + higher lows + AVWAP sloping up
Downtrend: lower highs + lower lows + AVWAP sloping downA flat AVWAP often signals a neutral or choppy environment where signals can be less reliable.
5) How do you trade AVWAP support in an uptrend without “catching falling knives”?
Rather than buying the first touch, treat AVWAP as a level of interest and wait for confirmation of strength after the test (e.g., reclaim/hold above, strong candle response). The stop is typically placed beneath the dip low (structure-based), not randomly.
6) What does it mean when AVWAP flips from support to resistance?
A flip often happens during trend transitions when price starts criss-crossing the line. After a break, the same AVWAP that acted as support can become resistance (and vice versa). This is useful for identifying when the market regime is changing and where supply/demand is reasserting control.
7) What are “AVWAP handoffs” and “pinches,” and why do they matter?
Handoff: when trend accelerates, you anchor a new AVWAP from a key support test on the original AVWAP. This creates “momentum layers” you can manage with structure and stops.
Pinch: price compresses between two AVWAPs (often one from a swing high and one from a swing low). It’s a tug-of-war setup—best traded after the break confirms the winner, not before.
8) What are the biggest mistakes traders make with AVWAP?
The common errors are:
Using AVWAP in choppy/sideways markets where it whipsaws
Anchoring randomly (anchors must be meaningful)
Entering on the first touch without confirmation
Ignoring stop-loss discipline (AVWAP is a tool, not a guarantee)
Treating AVWAP as “magic”—instead of combining it with trend context + structure + risk control
Related Reading
Inside the Financial Wisdom Weekly Consolidation Breakout Framework
Risk Management in Trading: The Foundation of Long-Term Profitability
Published by FinancialWisdomTV.com Rules-Based Breakout Trading | Quality & Momentum | Probability-Driven Execution

Comments