
How to Use Leverage to Supercharge Your Trading Returns (and Avoid Disaster)
- Jun 16, 2025
- 4 min read
Updated: Jan 2
Why Leverage Is Feared — And Why That Fear Is Often Misplaced
Leverage has a bad reputation.

Most investors associate it with:
Excessive risk
Margin calls
Large draw-downs
And in many cases, that reputation is deserved.
But leverage itself is not the problem - Volatility is.
When leverage is applied indiscriminately — especially during unstable market regimes — it magnifies losses, accelerates draw downs, and destroys compounding. When applied systematically, in stable environments, leverage can enhance returns without proportionally increasing risk.
This distinction is the central insight behind Michael Gayed’s award-winning research, Leverage for the Long Run, and it fundamentally changes how leverage should be understood.
The Core Insight: Leverage Is Environment-Dependent
Traditional finance theory assumes markets are efficient and largely random. Under that assumption, leverage simply scales risk and return linearly.
Real markets do not behave that way.
Markets move through:
Low-volatility, trending regimes
High-volatility, unstable regimes
Leverage performs very differently in each.

Gayed’s research demonstrates that:
Leverage enhances compounding in low-volatility, trending environments
Leverage destroys compounding in high-volatility, choppy environments
The challenge is not whether to use leverage — it is when.
The Constant Leverage Trap (Why Most Leveraged Strategies Fail)
One of the most important concepts in the research is the constant leverage trap.
Daily leveraged exposure suffers from path dependency:
After gains, exposure is increased from a higher base
After losses, exposure is reduced from a lower base
In volatile environments, this rebalancing effect erodes returns — even if the underlying market goes nowhere.
A striking example occurred in August 2011:
The S&P 500 gained roughly 0.5% over six volatile sessions
A 2× leveraged version of the index lost money
A 3× leveraged version lost even more
This is why constant leverage fails over time.
Leverage must be conditional, not permanent.
Volatility Regimes and Why They Matter
Volatility is not random - It clusters.
Periods of high volatility tend to persist, just as periods of low volatility tend to persist. This makes volatility observable and filterable.
Gayed’s research shows that:
When markets are calm and trending, returns arrive in streaks
These streaks allow leverage to compound effectively
When markets are unstable, sharp reversals dominate, which harms leveraged positions
Understanding regime matters more than predicting direction.
The Moving Average as a Volatility Filter
Rather than using moving averages as entry signals, the research uses them as regime filters.

Specifically:
When the market is above its moving average, forward volatility is lower
When the market is below its moving average, forward volatility is higher
This relationship holds across:
Different time periods
Different moving average lengths (10-day to 200-day)
Nearly a century of market data
This makes moving averages a simple but powerful proxy for market stability.
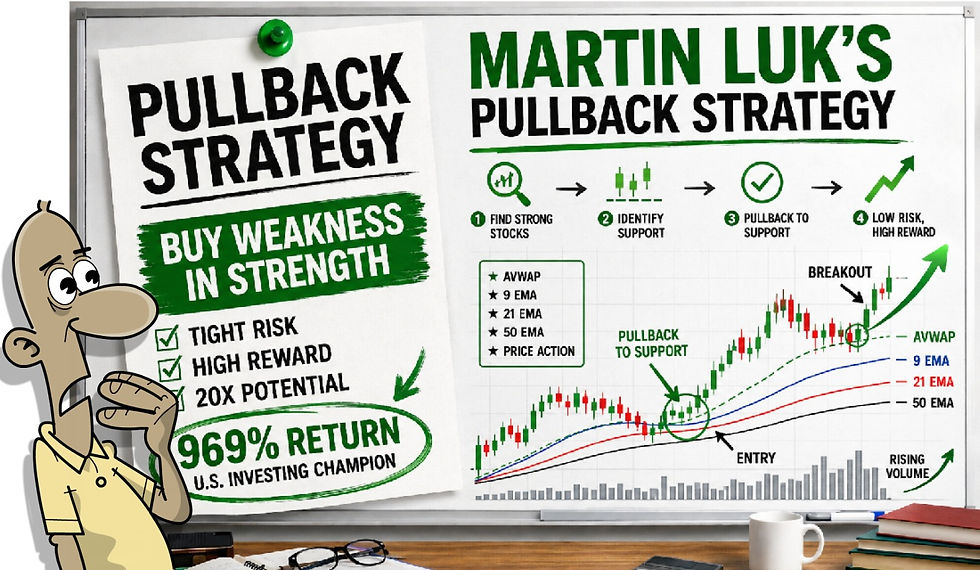
We completed our own study and found the 10 & 20 week EMA crossover to be a highly effective tool to combine with leverage, so much so that it is embedded in our own breakout strategy.
The Leverage Rotation Strategy (LRS)
The Leverage Rotation Strategy applies leverage only when conditions are favourable.
The rules are intentionally simple:
When the market closes above its long-term moving average:
Rotate into a leveraged exposure (e.g. 1.25×, 2×, or 3×)
When the market closes below the moving average:
Rotate into Treasury bills or cash
There is no prediction, no discretion, and very little trading.
On average, the strategy rotates only a handful of times per year.

The Results (Why This Matters)
Over nearly a century of data, the findings are striking:
Constant leverage produces extreme drawdowns
Conditional leverage dramatically improves:
Absolute returns
Risk-adjusted returns
Maximum drawdown
Recovery time
In the worst historical bear markets — including 1929, 1973, 2000, and 2008 — the leverage rotation approach reduced draw downs materially compared to buy-and-hold.
Shorter recovery times are critical. Investors who recover faster stay invested longer. Those who stay invested longer compound more effectively.
Why This Works Behaviourally
Even if investors understand the mathematics of compounding, most cannot tolerate large drawdowns.
The biggest enemy of long-term returns is not market efficiency — it is behavioural capitulation.
By reducing volatility and drawdowns, conditional leverage:
Improves survivability (Risk of Ruin)
Reduces emotional stress
Increases adherence to the strategy
This is not a theoretical advantage. It is a practical one.
How This Fits a Broader Rules-Based Philosophy
The key takeaway is not “use leverage”.
The takeaway is:
Exposure should expand in stable regimes and contract in unstable ones.
This principle appears across many successful trading and investment approaches:
Trend filters
Volatility contraction analysis
Regime-based position sizing
Leverage is simply another dimension of exposure — one that must be governed by rules.
Important Limitations
No strategy is perfect.
Volatility filters can under perform during persistent bull markets, where staying fully invested may outperform rotating to cash during brief pullbacks.

However, over full market cycles:
Reduced drawdowns
Faster recoveries
Improved risk-adjusted returns
…often outweigh short-term under performance.
Consistency, not optimisation, is the edge.
The Financial Wisdom Perspective
Leverage is neither good nor bad.
Used blindly, it destroys capital. Used selectively, it can enhance compounding.
The defining factor is regime awareness — knowing when markets are stable enough to support increased exposure.
This principle applies whether leverage is explicit (margin, leveraged ETFs) or implicit (position sizing, concentration).

Key Takeaways
Leverage amplifies volatility, not just returns
Constant leverage fails due to path dependency
Volatility regimes are observable and persistent
Moving averages act as effective stability filters
Conditional leverage improves draw downs and recovery time
Discipline and rules matter more than optimization
FAQs
Is leverage always dangerous? No. Leverage is dangerous when applied during high-volatility, unstable market regimes. Used conditionally in stable environments, it can improve outcomes.
Why do leveraged ETFs often under perform long term? Because they apply constant leverage and rebalance daily, which erodes returns in volatile markets.
Why use moving averages instead of volatility indicators directly? Moving averages are simple, robust proxies for regime stability and have proven effective across long datasets.
Does this strategy require frequent trading? No. The leverage rotation strategy averages only a few rotations per year.
Can this concept be applied without explicit leverage? Yes. The same principle applies to position sizing, exposure concentration, and risk scaling.
Published by FinancialWisdomTV.com Leverage | Volatility Regimes | Rules-Based Risk Management
FW Breakout Scanner:

Related Reading
Risk Management in Trading: The Foundation of Long-Term Profitability
Trading Psychology & Realistic Expectations
Time-Tested Trading Strategies: What Actually Works


Comments