
Factor Investing Explained: How Stockopedia Shows We Can Beat the Market
- Nov 29, 2020
- 4 min read
Updated: Jan 4
How Quality, Value, and Momentum Combine to Beat the Market.
Stockopedia Discount Code - HERE
Can the stock market really be beaten using a systematic, evidence-based approach?
According to decades of research — and the data demonstrated by Stockopedia — the answer is yes. Not by prediction or speculation, but by consistently focusing on specific factors that have been statistically linked to long-term outperformance.
This approach is known as factor investing.
In this article, we break down how factor investing works, how Stockopedia quantifies it, and why combining quality, value, and momentum can dramatically improve both returns and the probability of success.

What Is Factor Investing?
Factor investing is a quantitative approach that identifies specific characteristics — or “factors” — that are strongly correlated with stock market returns.
Rather than analysing companies subjectively, factor investing assigns numerical scores to measurable attributes such as:
Quality
Value
Momentum
Growth
Each factor captures a different dimension of a company’s financial and market behaviour. Numerous academic studies and real-world results show that these factors, when applied consistently, can outperform broad market indices over time.
How Stockopedia Quantifies Factors
Stockopedia takes factor investing a step further by scoring every stock from 0 to 100 across individual factors and then combining them into a single composite score.
The most widely used composite is the QVM StockRank, which blends:
Quality
Value
Momentum
Each stock is ranked relative to its peers, and these rankings are rebalanced quarterly, ensuring the system adapts as company fundamentals and market conditions change.
Stockopedia Discount Code - HERE
The Evidence: Factor Scores vs Market Returns
Stockopedia’s long-term data paints a clear picture.
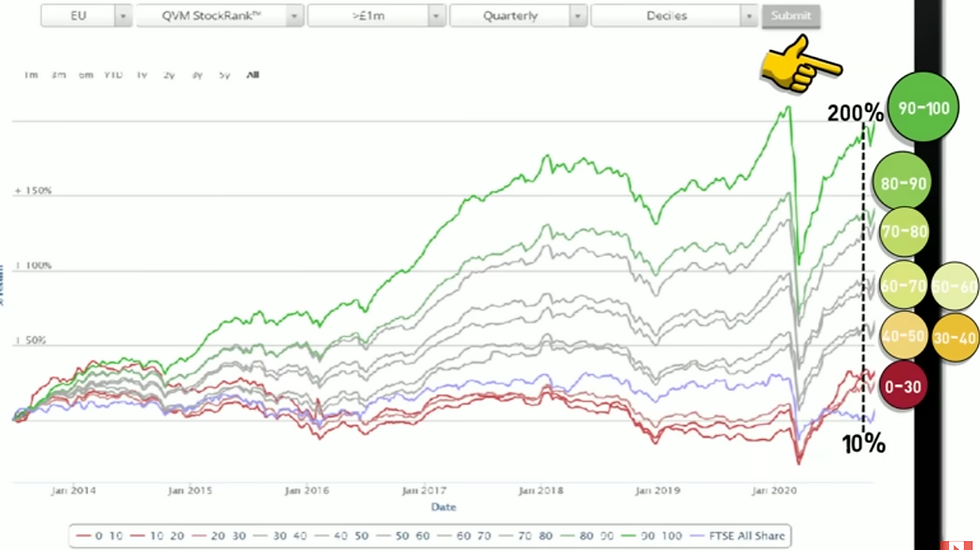
Using the European stock universe as an example, portfolios were constructed based on QVM StockRank ranges:

Stocks ranked 90–100 (highest quality, value, and momentum)
Stocks ranked 80–90
All the way down to 0–30 (lowest ranked stocks)
The results are striking.
While the FTSE All-Share Index delivered a return of around 10% over the same period, a portfolio of stocks ranked 90–100 generated returns of approximately 200%.
Just as important as returns is probability. The highest-ranked stocks didn’t just outperform — they also won more often.
Why Combining Factors Matters
Each factor works on its own, but their real power emerges when combined.
Quality filters out weak, fragile businesses
Value avoids overpaying for growth
Momentum keeps you aligned with improving trends
This mirrors how professional investors operate: buy good companies, at sensible prices, that are already moving in the right direction.
This is also the same logic that underpins my own approach — fundamentals first, followed by selective technical analysis to refine entries and manage risk.
Breaking Down the Core Factors
1. Quality: The Foundation
A quality company typically exhibits:
Strong profitability
Healthy margins
Positive and consistent cash flow
Sensible debt levels
Adequate liquidity
Stockopedia’s data from 2013 to 2018 shows a near-perfect correlation between quality rankings and annual returns.

Lowest quality stocks (ranked 0–10): –12.5% average annual return
Highest quality stocks (ranked 90–100): ~13% average annual return
Simply avoiding low-quality companies dramatically improves outcomes.
2. Value: Avoiding Overpayment
Value investing focuses on how much you pay for a company relative to what you get.
Stockopedia evaluates value using metrics such as:
Price-to-earnings
Price-to-book
Price-to-sales
Price-to-free-cash-flow
Dividend yield
Earnings yield
Stocks with the worst value scores produced average losses of around –4% per year, while the cheapest stocks delivered 10%+ annual returns.

Even momentum traders benefit from avoiding stocks that are fundamentally overpriced.
3. Momentum: The Leading Indicator
Momentum is the factor I personally place the greatest emphasis on.
Stockopedia splits momentum into two categories:
Price Momentum
Proximity to 52-week highs
50-day vs 200-day moving averages
Relative strength over 6–12 months
Earnings Momentum
Upgrades to earnings expectations
Positive earnings surprises
Momentum captures improving businesses — the stocks institutions are already accumulating.
Over the same six-year period, the highest-ranked momentum stocks produced average annual returns of around 20%, significantly outperforming lagging stocks.

The Power of the Combined QVM StockRank
When Quality, Value, and Momentum are combined, the results improve further.
Not only do returns increase — the odds of selecting a winning stock rise sharply.
Lowest-ranked stocks: ~33% probability of being profitable over 12 months
Highest-ranked stocks: ~67% probability of success
That difference alone can transform long-term performance.

Factors Across Sectors and Market Caps
The benefits of factor investing are not confined to one sector.
Stocks ranked 80–100 showed strong returns across multiple sectors, from Healthcare to Industrials and Technology. In contrast, stocks ranked 0–20 failed to deliver positive returns in any sector.

Across market capitalisations:
Microcaps showed the highest returns, albeit with higher volatility
Large and mid-cap stocks still demonstrated strong factor-driven outperformance

Low-ranked stocks consistently underperformed, regardless of size
Why Factor Investing Works
Factor investing works because it aligns with human and institutional behaviour:
Quality attracts long-term capital
Momentum reflects institutional accumulation
Value reduces downside risk
Rather than guessing which stock might outperform, factor investing systematically improves the odds.
Key Takeaways

Factor investing is evidence-based, not theoretical
Quality, Value, and Momentum are proven drivers of returns
High factor scores increase both returns and win probability
Avoiding low-quality, deteriorating stocks is critical
Combining factors with technical analysis improves execution
More Stockopedia videos:
FAQs: Factor Investing & Stockopedia
Is factor investing suitable for traders and investors?
Yes. Factors improve stock selection regardless of timeframe.
Does factor investing replace technical analysis?
No. It complements it by improving the quality of candidates.
How often are StockRanks updated?
Quarterly, ensuring rankings adapt to changing conditions.
Can factor investing beat the index consistently?
Historically, yes — when applied systematically and patiently.
Is momentum risky?
Momentum without quality is risky. Combined with quality, it is powerful.
Rather than trying to identify these factors manually, platforms like Stockopedia make the process objective and repeatable. It’s the service I personally use to filter for quality stocks with improving momentum, before applying my own technical and risk-management framework.
For those interested in thier service be sure to use the coupon code provided below:
Stockopedia Discount Code - HERE
Published by FinancialWisdomTV.com
Quality | Momentum | Probability-Driven Stock Selection
My Breakout Strategy combining fundamental factors and technicals:


Comments