
Stockopedia StockRank Strategy: How Fundamental Breakouts Can Find Winning Stocks
A 12-Year Stockopedia Study Reveals How Sharp Quality Rank Jumps, Small-Cap Re-Ratings and the 90/80 Rule Produced Strong Long-Term Returns

Summary:
Can a sudden improvement in a company’s fundamentals provide a genuine market edge?
This article examines a major Stockopedia study covering almost 6,000 StockRank jumps over 12 years. The research found that stocks making sharp weekly jumps into the highest-ranking group could significantly outperform both the wider market and stocks that already held high StockRank scores.

The strongest results came from Quality-driven jumps of around 10 to 40 points, particularly in neglected small- and mid-cap companies. By contrast, gradual improvements produced little edge, while extreme 40+ point jumps often carried higher failure and delisting risk. The study also found that Technology, Healthcare and Industrials performed best, while Financials and Energy were far less attractive.
Perhaps most importantly, this is a portfolio strategy rather than a stock-picking strategy. Individual outcomes were highly unpredictable, but a diversified basket of around 20 positions combined with Stockopedia’s 90/80 Rule, buying sharp jumps into 90+ and selling when the rank falls below 80, produced a reported net CAGR of 18.3%.
This guide breaks down the entire framework, the mathematics behind the edge, the risk controls, and real examples including Yü Group, Rolls-Royce and Carillion.

StockRank Jump Strategy: How Fundamental Re-Ratings Can Beat the Market
Most investors assume that once a stock has already experienced a major improvement in its fundamentals, the opportunity has been missed.
Stockopedia’s research suggests the opposite may often be true.
A sharp improvement in a company’s fundamental ranking can sometimes mark the beginning of a re-rating rather than the end of one.
That is the central idea behind this fascinating study.

Over a 12-year period, Stockopedia analysed almost 6,000 StockRank jumps and examined what happened when shares experienced sudden weekly improvements in their overall ranking.
The results were compelling.
A systematic strategy based around these rank jumps reportedly produced an 18.3% net compound annual growth rate, outperforming portfolios containing stocks that were already highly ranked. Importantly, the study attempted to account for real-world considerations such as trading costs, broker commissions and stamp duty.
The real value of the study, however, lies in understanding which jumps mattered, which were noise, and how the portfolio had to be structured to capture the edge.
What Is a StockRank?
StockRank is Stockopedia’s proprietary ranking system.
Every operating company is given a score between 0 and 100, based on three major factors:
Quality
Value
Momentum
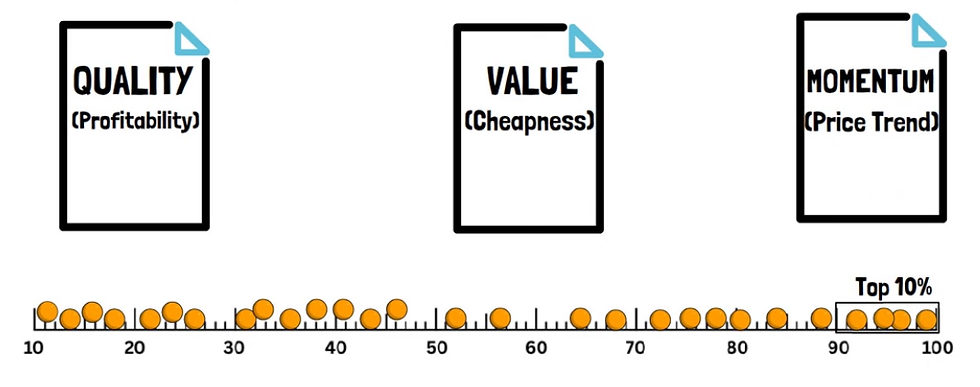
A score above 90 places a company in approximately the top 10% of the market.
The ranking is designed to combine both financial strength and market behaviour into one systematic score.
Rather than asking whether a company simply has a high score, this study focused on something more interesting:
What happens when the score suddenly improves?
A rank jump represents an abrupt change in how a company measures across those underlying factors.
The hypothesis is straightforward.
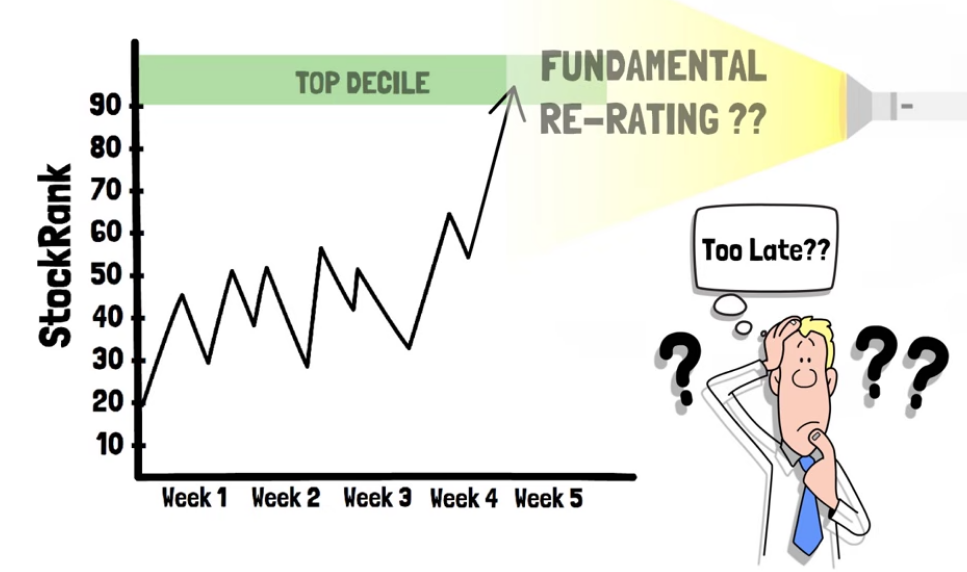
If a company’s fundamentals improve dramatically enough to push it into the top decile within a short period, the market may not immediately price in the full implications.
That lag can potentially create opportunity.
Buy the Leap, Not the Creep
One of the clearest findings from the study was that gradual rank improvements did not produce a meaningful edge.

Small weekly increases of perhaps 5 to 10 points were largely irrelevant.
In fact, stocks slowly moving into the 80–90 range underperformed companies already sitting within that group.
Why?
Because gradual changes often represent information the market has already absorbed.
The fundamental improvement is no longer surprising.
The stock has simply been climbing through the ranking system slowly.
The genuine edge appeared when companies experienced a sharp weekly jump of approximately 10 to 40 points.
These moves were more likely to reflect significant fundamental change.

Examples might include:
Rapidly improving profitability
Revenue acceleration
Margin expansion
Better cash flow
Improving return on capital
In other words, something important has changed quickly.
Why Extremely Large Jumps Can Be Dangerous
You might assume that an even larger jump would produce an even stronger signal.
The research found otherwise.
When StockRanks jumped by more than around 40 points in a week, the edge weakened substantially.

These stocks generated much poorer subsequent returns and experienced significantly higher delisting rates.
Such enormous jumps may reflect:
Distressed stocks bouncing from extremely low rankings
Takeover speculation
Highly speculative situations
Sudden mechanical changes in valuation metrics
Rather than indicating quality, extreme jumps may sometimes indicate instability.
The sweet spot appears to be meaningful but not extreme improvement.
Small and Mid-Caps Produced the Strongest Edge
One of the most important findings concerned company size.
The StockRank jump effect was strongest among smaller companies.
Stocks below approximately £350 million market capitalisation produced the most attractive returns following Quality Rank jumps.
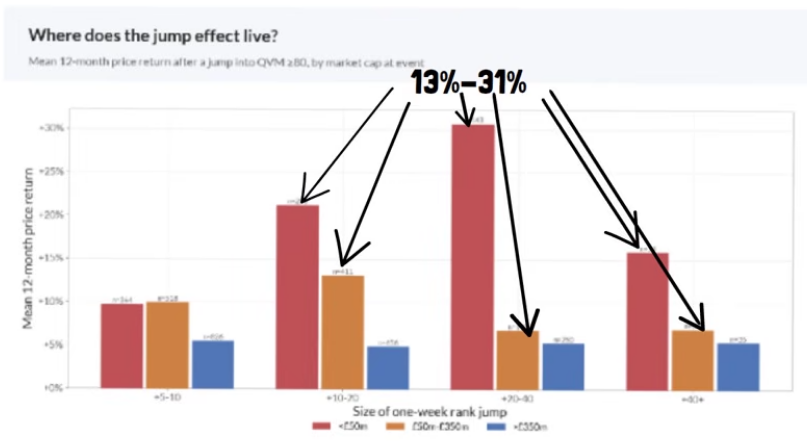
Large-cap companies performed far less impressively.
The logic makes sense.
Large companies are analysed constantly.
They may have:
Dozens of institutional analysts
Extensive media coverage
Large investor-relations teams
Deep institutional ownership
When their fundamentals improve, the market often reacts quickly.
Smaller companies receive less attention.
New information may take weeks or months to reach the wider investment community.

That slower repricing process potentially creates the opportunity.
However, the study also imposed a lower limit of approximately £10 million market capitalisation to avoid extremely illiquid companies.
Quality Was the Real Driver
StockRank combines Quality, Value and Momentum.
But not all three contributed equally to the rank-jump effect.
The strongest results came from Quality.

A weekly Quality Rank increase of around 20 to 40 points into a score of 90 or higher significantly outperformed incumbent high-quality stocks.
This is important.
It suggests the market may underreact to major improvements in corporate fundamentals.
The types of changes reflected in Quality can include:
Better margins
Higher profitability
Improving cash generation
Rising returns on capital
Stronger balance sheets

When several of these improve simultaneously, a company's financial profile can change dramatically.
And the share price may continue adjusting long after the initial results announcement.
Why Value Jumps Were More Dangerous
Value jumps behaved very differently.
A stock can suddenly appear cheaper because the company improves.
But it can also become "cheap" because the share price collapses.
That distinction matters enormously.
The study found that Value Rank jumps were associated with much higher delisting rates.

This is the classic value trap.
A company looks statistically inexpensive, but only because the market is correctly anticipating deteriorating fundamentals.

A collapsing share price can mechanically improve valuation ratios while the underlying business gets worse.
For that reason, a rapid Value Rank improvement should not automatically be interpreted as a positive catalyst.
Sector Selection Matters
The StockRank jump effect was also highly uneven across industries.
The strongest sectors included:
Healthcare
Technology
Industrials
Healthcare and Technology reportedly produced hit rates between approximately 65% and 71% against sector peers.
By contrast:
Financials produced a negative relative edge.
Energy barely improved on already weak sector performance.
This means the strategy can potentially be improved by excluding sectors where the signal historically produced poor results.

According to the study, simply removing Financials and Energy eliminated around 27% of events while disproportionately removing many of the weakest outcomes.
This is a powerful reminder that a factor strategy should not necessarily be applied identically across every industry.
This Is a Basket Strategy, Not a Stock-Picking Strategy
Perhaps the single most important lesson from the entire study is this:
You cannot rely on picking one or two stocks.
Only around 53% of qualifying rank jumps made money.
That is barely better than a coin toss.
The real edge came from the distribution of returns.
The median stock generated only around 1.5%.
Yet the mean return was approximately 18.8%.
That enormous difference occurred because a small number of exceptional winners dragged the average dramatically higher.

Examples included stocks such as:
Ferrexpo
Yü Group
which produced several-hundred-percent gains.
This creates a familiar pattern for anyone who studies momentum and trend-following systems:
Most trades are ordinary. A small number of outliers drive the majority of long-term profits.
Why 20 Stocks Worked Better Than Five
Because the strategy relies on rare, exceptional winners, diversification becomes essential.
Stockopedia found that a portfolio of around 20 equal-weighted positions provided a good balance between capturing upside and controlling volatility.
According to the simulation:
The 20-stock approach reduced volatility.
Maximum drawdown remained around 26%.
The portfolio maintained exposure to enough stocks to increase the probability of catching the major winners.
A five-stock portfolio was far more problematic.
The study estimated an 84% probability of missing the major outperformers entirely.
That resulted in:
Higher volatility
Less reliable performance

This is why the strategy should not be viewed as concentrated stock picking.
The edge comes from systematically owning enough candidates for the statistical distribution to work in your favour.
Portfolio Turnover
The strategy was not particularly high frequency.
A 20-position portfolio generated approximately 22 new positions per year.
That means the portfolio effectively turned over around once annually.
For investors who prefer relatively low-maintenance strategies, this is an attractive characteristic.
You do not need to trade every day.
Instead, the process revolves around:
Weekly ranking changes
Systematic entries
Weekly exit monitoring
The 90/80 Rule
The exit strategy was arguably just as important as the entry.
Stockopedia compared two main approaches.
Fixed 12-Month Exit
Buy the stock and sell exactly one year later.
This produced a reported CAGR of approximately 13.5%.
The 90/80 Rule
Buy when a stock jumps into a 90+ StockRank.
Sell on the first weekly reading below 80.
This improved performance significantly.
The basic 90/80 framework reportedly generated around 16.5% net, while the optimised 20-stock portfolio achieved approximately 18.3% net CAGR.

The median holding period settled around nine and a half months.
This is a useful concept because it allows the ranking system itself to determine whether the original fundamental improvement remains intact.
Rather than selling simply because 12 months have elapsed, you remain invested while the underlying score remains strong.
Why the Exit Rule Matters So Much
Private investors often focus almost entirely on buying.
But selling is equally important.
Without a systematic exit mechanism, a fundamentally improving business can eventually deteriorate again.
The 90/80 Rule acts as an objective signal.
If the company's overall ranking falls significantly, something has changed.
That may include:
Declining Quality
Weakening Momentum
Deteriorating Value characteristics
Whatever the underlying reason, the rule removes emotion.
You simply follow the data.
Case Study: Yü Group
Yü Group was one of the most impressive winners in the study.
In October 2022, the independent utility supplier had a market capitalisation below £350 million.

Following strong results, its StockRank jumped 24 points to 99 in a single week.
That represented almost the ideal setup:
Small-cap company
Large but not extreme rank jump
Entry into the top decile
Strong fundamental improvement
Over the following year, the shares gained roughly 490%.
Interestingly, the move was not a sudden speculative spike.
The price advanced gradually as successive company announcements confirmed that trading remained ahead of expectations.
Analysts adjusted forecasts upward incrementally.
The market slowly absorbed the new reality.
Eventually, the rising share price reduced the Value component enough for the overall StockRank to fall below 80.
Under the 90/80 Rule, that would have triggered the exit after an extraordinary gain.
Case Study: Rolls-Royce
Rolls-Royce provides a useful large-cap example.
In early 2023, the company was still recovering from the damage created during the pandemic.

Following its full-year results, its StockRank jumped approximately 27 points to 88.
Although it did not quite reach the 90 threshold, it was close enough to demonstrate the underlying re-rating phenomenon.
Over the following 12 months, Rolls-Royce gained approximately 147%.
The example shows that even large companies can occasionally experience structural re-ratings significant enough to produce major returns.
However, the broader study still found the effect substantially stronger among smaller companies.
Case Study: Carillion
No systematic strategy should be judged only by its winners.
Carillion demonstrates why risk management matters.

In January 2017, the company experienced a 12-point StockRank jump to 81.
Because the researchers were also examining jumps into the 80s, the systematic framework would have generated a buy.
The company later collapsed.
The stock ultimately lost approximately 94%.
This is precisely why the exit rule matters.
As Carillion's financial condition deteriorated, its StockRank began falling.
The systematic strategy would have exited once the ranking dropped below the predetermined threshold, long before the final collapse.
Without that rule, an investor could have ridden the company almost to zero.
The Rogues’ Gallery
Carillion was not the only disaster.

Other companies in the study experienced catastrophic declines, including names such as:
Afren
Morses Club
Flybe
Some lost around 98% of their value.
Again, this reinforces the central principle:
A strategy does not need every investment to succeed. It needs a positive distribution of outcomes combined with strict risk control.
Why This Strategy Works
The StockRank jump strategy appears to exploit a familiar market behaviour:
Investors underreact to significant fundamental change.
When a smaller company suddenly produces:
Better profitability
Improving margins
Stronger cash flow
Accelerating revenue
The market may initially respond positively.
But institutions and analysts often take time to fully update their assumptions.
That creates a gradual re-rating.
The jump itself therefore may not mean the opportunity has passed.
It can be the first sign that something significant has only just begun.
The Right-Tail Effect
The mathematics of this strategy are particularly interesting.
Only around half of the individual stocks produced gains.
The median outcome was unimpressive.
Yet the portfolio performed strongly because a small number of companies became enormous winners.
This is known as a positively skewed distribution.
The downside is generally limited to the capital allocated to one position.
But the upside can reach:
100%
200%
400%
500%+
This creates asymmetry.
The strategy survives numerous mediocre positions because a handful of multi-baggers drive the overall portfolio forward.

The Complete StockRank Jump Framework
Based on the study, a simplified version of the process looks like this:
Step 1: Find Sharp Rank Jumps
Focus on approximately 10–40 point weekly increases.
Avoid slow rank drift and extremely large speculative jumps.
Step 2: Focus on High Final Rankings
Prefer jumps into 90+ StockRank.
Step 3: Prioritise Quality
Quality Rank improvement produced the strongest evidence of an edge.
Step 4: Focus on Smaller Companies
Prefer companies between approximately:
£10 million and £350 million market capitalisation.
Step 5: Consider Sector
Historically stronger areas included:
Technology
Healthcare
Industrials
Step 6: Build a Basket
Hold roughly 20 equally weighted positions rather than concentrating on individual ideas.
Step 7: Follow the 90/80 Exit
Remain invested until the StockRank closes below 80 on the weekly observation.

What Traders Can Learn From the Study
Even if you never use StockRank mechanically, there are several lessons worth taking from the research.
First, improving fundamentals matter.
A company changing from mediocre to exceptional may offer more upside than one that has already been excellent for years.
Second, smaller companies are less efficiently priced.
Less analyst coverage can result in slower repricing.
Third, Quality improvements appear more useful than simple cheapness.
Buying falling stocks simply because they have become statistically inexpensive can be dangerous.
Fourth, outliers matter enormously.
Trying to avoid every losing position can prevent you from ever owning the few stocks capable of generating extraordinary returns.
Finally, systematic exits are essential.
No company remains fundamentally strong forever.
Final Thoughts
The Stockopedia StockRank jump study provides an excellent example of how systematic investors can potentially exploit slow-moving fundamental re-ratings.
The strongest historical characteristics were clear:
Sharp weekly jumps rather than gradual improvements.
Final StockRanks above 90.
Quality-driven changes.
Small- and mid-cap companies.
Stronger sectors such as Technology and Healthcare.
Diversification across approximately 20 holdings.
A disciplined 90/80 exit mechanism.

The reported 18.3% net CAGR is impressive, but perhaps the most important lesson lies underneath that number.
The strategy did not work because every stock was a winner.
Only around half were profitable.
It worked because losses and mediocre outcomes were overwhelmed by a small number of extraordinary companies.
That is a principle that appears repeatedly across investing and trading strategies.
You do not need certainty.
You need an edge, enough opportunities for that edge to play out, and the discipline to execute the rules consistently.
And sometimes a sudden fundamental improvement isn't evidence that you've missed the move.
It may be evidence that the move has only just started.

Frequently Asked Questions
What is Stockopedia StockRank?
StockRank is a 0–100 ranking system combining Quality, Value and Momentum factors to rank companies relative to the wider market.
What is a StockRank jump?
A StockRank jump occurs when a company's ranking improves significantly over a short period, potentially signalling a major fundamental re-rating.
What size StockRank jump performed best?
The study found the strongest edge among weekly jumps of approximately 10 to 40 points rather than gradual changes or extreme 40+ point jumps.
Which StockRank factor was most important?
Quality produced the strongest results, while Momentum and Value jumps showed much weaker evidence of additional outperformance.
Why did small-cap stocks perform better?
Smaller companies typically receive less analyst and institutional coverage, allowing new fundamental information to take longer to become fully reflected in the share price.
What is the 90/80 Rule?
The strategy buys qualifying stocks entering a StockRank above 90 and sells when the score subsequently closes below 80 on a weekly reading.
How many stocks should the portfolio hold?
Stockopedia's study found approximately 20 equal-weighted positions provided a useful balance between capturing outliers and controlling volatility.
What was the strategy's win rate?
Approximately 53% of qualifying StockRank jump events produced positive returns.
Why can the strategy work with only a 53% success rate?
A relatively small number of multi-bagger stocks generated exceptionally large gains, pushing the portfolio's average return far above its median result.
Does this strategy eliminate major losses?
No. Individual companies still produced catastrophic declines, which is why diversification and systematic exit rules are critical.
Use this link for a 25% discount on the Stockopedia website - Discount page
Those interested in a structured, rules-based approach with factors and the charts, explore the Financial Wisdom Strategy, available free, which outlines a complete framework refined over decades.

Related Reading
Inside the Financial Wisdom Weekly Consolidation Breakout Framework
Risk Management in Trading: The Foundation of Long-Term Profitability
Published by FinancialWisdomTV.com Trading Education | Risk Management | Trading Strategy | Trading Psychology


Comments