
How Legendary Traders Enter Breakouts (Minervini, Kullamagi, Darvas, O’Neil)
- Feb 23
- 4 min read
The exact breakout entry strategies used by the best traders in the world.
Summary:
This article dissects the breakout entry techniques of four legendary traders: Mark Minervini, Kristjan Kullamägi, Nicolas Darvas, and William O’Neil. Each trader uses a structured approach to identify stocks emerging from consolidation, execute precise entries at inflection points, and control risk through disciplined stop placement.
Despite different chart patterns — VCPs, stair-step momentum, box breakouts, and cup-and-handle bases — the core principle remains identical: tight risk, explosive reward. Learn how these masters create positive expectancy, apply systematic trade management, and build the asymmetric risk-to-reward framework that has produced some of the most extraordinary returns in trading history.
Download our FREE trading strategy for the approach I have used for decades:

In this video, we explore the precise breakout entry techniques of four legendary traders: Mark Minervini, Kristjan Kullamägi, Nicolas Darvas, and William O’Neil.
The mathematics behind breakout trading are simple:

Identify stocks emerging from consolidation
Enter at precise inflection points
Control downside with structured stops
Let reward multiples exceed risk
Yet most traders fail to replicate the extraordinary returns achieved by these legends.
Minervini averaged over 220% annually for six consecutive years:
Kullamägi turned $9,100 into $82 million:
Darvas converted $10,000 into $2 million.O’Neil’s CANSLIM system identified countless multi-baggers:
The difference isn’t complexity — it’s precision and discipline.
Mark Minervini – The Volatility Contraction Pattern (VCP)

Minervini only buys stocks in Stage 2 uptrends:
Above rising 200-day MA
Above rising 50-day MA
Pattern of higher highs and higher lows
High Relative Strength
This eliminates weak stocks immediately.
The VCP Architecture
The VCP displays progressively tighter pullbacks:

First pullback: 15–20%
Second: 8–12%
Third: 3–8%
Each contraction shows reduced volatility and declining volume.
This signals diminishing supply.
The Breakout Trigger
Entry occurs when price breaks the most recent pivot on 40–50% above-average volume.
Minervini buys as price clears resistance — not at close.
Stops are placed below the most recent contraction low, typically 3–7% risk.

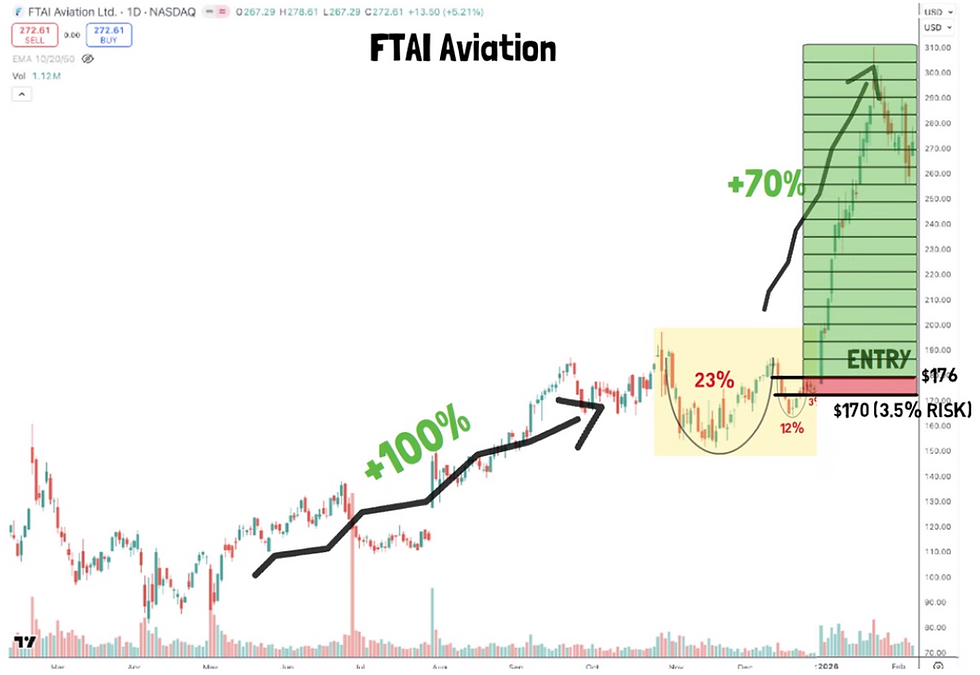
Example: FTAI Aviation (2025)
Pullbacks: 23%, 12%, 3%. Breakout at $176.Stop at $170 (3.5% risk).Advance: 70% in one month.
Asymmetry created a 1:20 reward-to-risk profile.
Kristjan Kullamägi – The Stair-Step Momentum System
Momentum Filter
Kullamägi only considers stocks up 30–100% in the prior 12 weeks.
This ensures institutional sponsorship.
Consolidation Criteria

Higher lows
Tight range
Respect for 10 & 20-day EMAs
Volume contraction
Entry Execution
Entry occurs at:
Trendline breakout
Opening range high (1-min, 5-min, or 60-min)
Break of prior day high
Stop = breakout day low (often 2–3%).
Example: Western Digital (WDC) 2025

Breakout at $165.Stop at $162 (2%).Advance: 70% in two months.
A 1:35 risk-reward trade.
Win rate: 20–25%.Winners: 5–20R.

Nicolas Darvas – The Box Breakout System

52-Week High Filter
Darvas only traded stocks making new 52-week highs.
Box Formation
After the high, price forms a defined trading range.
Multiple touches of resistance and support strengthen the setup.
Breakout Entry
Buy orders placed slightly above resistance.
Stop-loss inside box (5–8%).
Volume expansion required.

Example: Anglogold (AU) 2025
Box at $45.Entry at $45.50.Stop at $42 (6%).Advance: 150% over 34 weeks.
1:25 reward-to-risk.

Pyramiding
Darvas added to positions as new boxes formed higher.
Stops were raised accordingly.

William O’Neil – The Cup & Handle Precision
Prior Advance Requirement
Minimum 30% advance before cup forms.
Cup Formation
Duration: 7–65 weeks
Depth: 12–33%
Rounded bottom

Handle Structure

1–5 weeks
Upper third of cup
Volume contraction
Breakout Trigger
Entry above handle high on 50%+ volume expansion.
Stop: 4–8% below entry.
Example: SNDK (2025)
Handle breakout at $262.Advance: 170% in one month.
Massive asymmetry.

The Common Thread
Despite different patterns:
All demand tight risk
All wait for volume confirmation
All buy strength, not weakness
All rely on asymmetric reward
Breakouts are not about prediction — they are about structured opportunity with defined downside.

My Own Adaptation
I follow a Darvas-style approach on weekly charts:
Lateral consolidations
Weekly close above resistance
Stop placed mid-range (<8% risk)

A bespoke scanner identifies candidates automatically, allowing a passive weekend review process:

Final Thoughts
The frameworks are proven. The math is simple. The edge is execution.
Study the structures. Understand the risk. Execute without emotion.
Breakout trading rewards precision — not prediction.
FAQs
1. What do all four traders have in common?
They buy breakouts from consolidation with tight risk and volume confirmation.
2. Why is volume important in breakouts?
It confirms institutional participation and reduces failure probability.
3. What is the ideal stop-loss range?
Typically 3–8%, depending on pattern structure.
4. Do these systems require high win rates?
No. They rely on large reward multiples to offset frequent losses.
5. Which pattern is best for beginners?
Darvas boxes or simple weekly consolidations are easiest to implement.
6. How important is market stage?
Critical. Most only buy in strong market conditions.
7. Can these strategies work today?
Yes. They are based on human behaviour and institutional accumulation.
8. Is breakout trading risky?
Only if risk is not tightly defined.
If you want to see our stock trading approach built on similar approaches.:
Download the Free strategy PDF
Explore the Bespoke breakout scanner
Join the group where I share trades, portfolio management, and execution logic in real time
Those interested in a structured, rules-based approach can explore the Financial Wisdom Strategy Blueprint, available free, which outlines a complete framework refined over decades.

Related Reading
Inside the Financial Wisdom Weekly Consolidation Breakout Framework
Risk Management in Trading: The Foundation of Long-Term Profitability
Published by FinancialWisdomTV.com Trading Education | Risk Management | Trading Psychology


Comments