
Martin Luk’s 1358% Swing Trading Strategy: From GameStop Blow-Up to US Investing Champion
- Feb 12
- 5 min read
Step By Step Strategy Tutorial
Summary:
This video breaks down the systematic swing trading strategy of Martin Luk, the 23-year-old trader who reportedly delivered a 1358% return in the 2025 US Investing Championship after achieving 283% in 2024.
We examine his complete framework: a three-scanner stock selection process, precision breakout entries with tight stop-losses, dynamic position sizing, and adaptive exit strategies. With a 23% win rate but a 5:1 reward-to-risk profile, Luk proves that trading success comes from asymmetry, discipline, and strict risk control — not prediction.
From his early GameStop mistake to becoming a top-performing competitor, this is a deep dive into how systematic execution can transform trading results.
Download our FREE trading strategy for the approach I have used for decades:

From Beginner’s Luck to Systematic Excellence

Today we’re dissecting the swing trading strategy of Martin Luk — a 23-year-old trader from Hong Kong who reportedly produced a 1358% return in the 2025 US Investing Championship, following a 283% gain in 2024.
His journey is not one of overnight brilliance. It began with buying GameStop at the exact parabolic high in 2021. He tripled his account through beginner’s luck — then suffered a brutal 50% drawdown.
That painful reset became the foundation for a fully systematic trading approach built on one principle:
“I can’t predict my return — but I can control my risk.”

The Foundation: Risk-First Philosophy

Martin’s 2024 statistics tell the real story:
104 winners
319 losers
23% win rate
Average win: +15%
Average loss: -3%
This is pure asymmetry.
When you risk 3% to make 15%, you only need to be right 17% of the time to break even.
His edge is mathematical, not predictive.
But there’s more.
The Parabolic Stop-Loss Effect

By tightening stops from 3% to 1.5% on a large winner, he multiplies risk units dramatically.
25% gain with 3% stop = ~8R
25% gain with 1.5% stop = ~16R
This is geometric growth.
Precision entries aren’t cosmetic — they are structural.
The Three-Scanner Discovery System
Martin hunts fast-moving stocks in hot sectors with ADR above 5%.
His opportunity pipeline comes from three scanners:
1. Pre-Market Scanner
Identifies gap-ups on heavy volume before the open. Used to prepare for episodic pivot trades.
2. Potent Scanner
Finds prior-day strongest performers. Used to identify sector rotation and thematic momentum (crypto, quantum, AI).
Weekly relative strength rankings. Acts as both stock finder and market health gauge.
When leaders expand — markets are strong.When they contract — reduce exposure.
He often filters to the top 2% of names, similar to Qullamaggie’s approach.
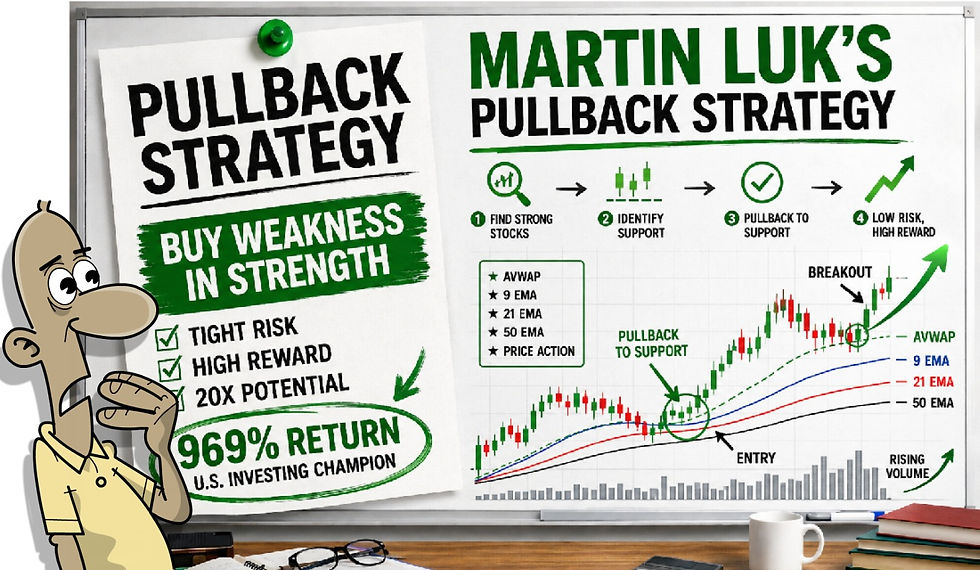
Precision Entry Techniques
Martin doesn’t blindly buy breakouts.
He waits for:
Tight inside days
EMA convergence (9, 21, 50)
Opening Range High breakouts
Clean range expansion

He constantly shifts between daily, hourly, and 5-minute charts to reduce stop width.
Why?
Because smaller stops allow larger size — while keeping dollar risk constant.
Baseline risk: 0.5% per trade
Max portfolio exposure: 35%
Reduced exposure during drawdowns
Increased exposure during favorable equity curve phases
Stops are typically set at:
Breakout day low
Or 5-minute entry candle low (if breakout-day stop too wide)

He adjusts exposure based on market feedback and personal performance.
Exit Strategy Framework
Martin uses:
Selling Into Strength
Trim 10–15% at 3R+
Reduce oversized positions
Sell when euphoric
Selling Into Weakness
Trail with 9 EMA
Use 21 or 50 EMA in strong trends
Use swing lows
Exit strategy adapts to:
Market stage
Profit cushion
Equity curve position

Case Study: GameStop 2024
Entry: $26.30Stop: $25.47 (3% risk)
Captured 54R as price exploded to $70+.
Trimmed half at 12R near resistance. Held remainder until major resistance near $76.
Disciplined scaling — not emotional exiting.
Case Study: COIN
Martin traded Bitcoin momentum through Coinbase.
Initial trade:
Violated entry rules
Panic-sold too early

Second trade:
Entry: $117
Stop: 2%
Exit: 20R (40% gain)
Lesson: Discipline > intelligence.
Case Study: AMD 2025
Entry on breakout through converging EMAs. 2x ETF used for leverage.
Massive 30% gap-up next day.

He held — resisted emotional profit-taking.
Exited during broad market weakness.
System first. Emotion second.
The Scanning-to-Execution Workflow
Morning prep:
30 mins in strong markets
15–20 mins in corrections
Watchlists:
Leading stocks
Mediocre
Lagging
Pillar (mega caps)
Market health is measured through list expansion/contraction.

Psychological Evolution
Martin’s three former weaknesses:
Revenge trading
Increasing risk after losses
Stop-loss violations
His success came not from eliminating mistakes — but from reducing their size.
Progress, not perfection, builds equity curves.

Key Takeaways
Low win rate is acceptable with asymmetry
Tight stops create geometric return potential
Scanners provide context
Exit strategy adapts to conditions
Risk management forgives mistakes
Extraordinary returns are possible — but only through systematic discipline.

Frequently Asked Questions (FAQs)
1. How can Martin Luk succeed with only a 23% win rate?
Because his average winner (15%) is five times larger than his average loss (3%), creating positive expectancy.
2. What is the most important part of his system?
Risk management and tight stop-loss discipline.
3. How much does he risk per trade?
Approximately 0.5% of total capital.
4. What types of stocks does he trade?
High ADR momentum stocks in hot sectors.
5. Does he trade only breakouts?
Primarily breakouts and episodic pivots, but adapts to market conditions.
6. How does he determine market health?
By tracking scanner expansion/contraction and his own trade performance.
7. Does he ever break his rules?
Yes — but he acknowledges mistakes and reduces their impact through strict risk control.
8. Is this strategy suitable for beginners?
Only if you understand position sizing and stop-loss discipline first.
9. What timeframe does he use?
Daily and intraday charts (1-min to 5-min for entries).
10. What is the biggest lesson from his journey?
Systematic execution beats prediction.
If there’s one final lesson from Martin Luk’s evolution, it’s this:
The market rewards structured risk, not emotional conviction.
And that principle never changes.
If you want to see our stock trading approach built on similar approaches.:
Download the Free strategy PDF
Explore the Bespoke breakout scanner
Join the group where I share trades, portfolio management, and execution logic in real time
Those interested in a structured, rules-based approach can explore the Financial Wisdom Strategy Blueprint, available free, which outlines a complete framework refined over decades.

Related Reading
Inside the Financial Wisdom Weekly Consolidation Breakout Framework
Risk Management in Trading: The Foundation of Long-Term Profitability
Frequently Asked Questions
1. Why use weekly charts instead of daily charts? Weekly charts reduce noise, highlight true market structure, and align better with longer-term trends and institutional activity.
2. What role does the 20-week moving average play in this strategy? The 20-week moving average acts as a dynamic support and resistance level and helps confirm trend direction.
3. Is this a predictive trading strategy? No. This is a reaction-based approach that responds to confirmed price action rather than trying to forecast outcomes.
4. How are trendlines drawn in this example? Trendlines are drawn using clear pivot points formed by strong reversals and confirmed price rejection areas.
5. When is an entry confirmed? Entries are taken only after price closes above resistance or a trendline, often in confluence with reclaiming the 20-week moving average.
6. How are exits determined? Exits are considered when price breaks key support levels, trendlines, or shows confirmed weakness through structure changes.
7. Can this approach be used on other timeframes? Yes. While this example uses weekly charts, the same principles apply to daily or intraday timeframes.
8. Do indicators like MACD add value here? Yes. Indicators like MACD can add confirmation, but price action remains the primary decision-making tool.
Published by FinancialWisdomTV.com Trading Education | Risk Management | Trading Psychology


Comments