
Darvas Box Strategy Backtest: Five Years of Results
The Darvas Box is easy to describe: wait for a stock to consolidate, then act only after price breaks above resistance. The difficult question is whether that simple idea still holds up when every signal, including failed breakouts, is tested across several market regimes. This case study uses a rules-based portfolio backtest from January 2022 to October 2026, a period that includes the 2022 bear market as well as a strong subsequent recovery.
In This Guide
The exact universe, box and breakout rules used in the test
How the initial stop and R-based partial exits were modelled
The headline return, drawdown and trade statistics
What the sensitivity tests reveal about robustness
The limitations that matter before applying any historical result
What Was Tested?
The test began with US-listed stocks across four exchanges, a minimum market capitalisation of $1 billion, and minimum Quality and Growth scores of 60. Signals were evaluated on completed weekly candles. When more candidates qualified than the portfolio could hold, the combined Quality and Growth score determined which opportunities received priority.
This matters because a strategy is more than a chart pattern. The universe, ranking method, number of available positions, exposure limit and order timing all influence the result. A backtest that ignores those portfolio constraints can quietly assume capital was available for every attractive signal.
The original strategy review as disclosed by Nicolas Darvas book can been seen in this video:
The Darvas Box and Breakout Rules
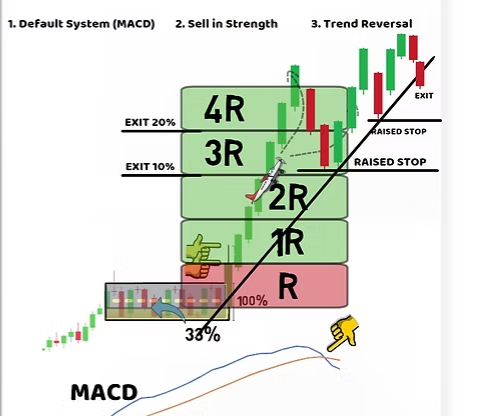
The consolidation required at least six completed weekly bars and could be no more than 20% high from support to resistance. The initial stop was placed 33% up from the bottom of the box, while any setup requiring more than 16% initial risk was rejected.
A breakout needed to close at least 4% above the box resistance and finish in the top quarter of its weekly range, a minimum close-strength reading of 75%. Volume had to be at least 1% higher than the previous week. The stock also needed to be above its 20-week exponential moving average with weekly MACD positive at entry.
The model did not buy the breakout close itself. Entry was set 0.01% above that completed close, so price still had to trade through the trigger. This small detail prevents the test from assuming an entry that was not available after the signal was confirmed.

Position Sizing and Trade Management
Each position used 10% of current portfolio equity, with maximum exposure capped at approximately 120%. The protective stop defined one unit of risk, or 1R. That made the outcome comparable across stocks with different prices and stop distances.
The staged-exit version sold nothing at 1R, 10% of the original position at 2R, 15% at 3R and 25% at 4R. The remaining position was managed with a raised stop. This attempts to bank part of a strong move without automatically selling the entire holding simply because it reached a round-number target.
R is not the percentage gained on the stock. It is the gain or loss divided by the original planned risk between entry and stop. A trade with 10% initial risk that rises 20% has advanced approximately 2R before costs and execution differences.
Five-Year Backtest Results
Under these assumptions, the model produced a total return of about 412.8%, equivalent to a compound annual growth rate near 40.7%. It recorded 195 trades, with 186 closed and nine still open at the end of the test. A further 431 qualifying signals were skipped because the portfolio’s position and exposure rules left no capacity.
The reported win rate was 59.7%, average return per trade was 9.6%, and the average winner was about 1.9 times the average loser. Maximum modelled drawdown was 16%. The result substantially exceeded the buy-and-hold S&P 500 comparison shown in the test, although the strategy also had higher annual volatility and depended on its specific exposure and execution assumptions.

What the Sensitivity Tests Reveal
A useful backtest should do more than display its best equity curve. It should show what happens when reasonable assumptions change. Removing the partial exits increased the historical result to roughly 469%, or about 44% CAGR. That does not prove partial exits are wrong; it shows the cost of reducing exposure to exceptional winners during this particular sample.
Raising the minimum Quality and Growth scores from 60 to 70 reduced the total return to about 220% and CAGR to roughly 28%. One possible explanation is that fundamental scores can lag an early re-rating, causing a stricter screen to admit a stock only after part of its move has occurred.
Increasing maximum exposure towards 200% lifted the modelled return to around 486%, but leverage also increases drawdown, volatility and the damage caused by gaps or correlated losses. A higher backtest return is not automatically a better real-world portfolio.

How to Interpret the Evidence
These figures are hypothetical historical results, not a promise of future performance. They can be affected by data quality, survivorship bias, order assumptions, spreads, slippage, fees, taxes and the availability of shares or liquidity. A strategy adjusted after reviewing its own results can also become over-fitted to the sample.
The strongest conclusion is therefore not that 41% annual growth should be expected. It is that the Darvas idea can be expressed as a complete, falsifiable process: define the universe, wait for a completed box, demand a measurable breakout, reject excessive risk, rank competing signals and manage every position consistently. Those rules can then be tested on new data rather than defended with selected winning charts.
Practical Takeaways
Write every entry, stop, ranking and portfolio rule before reading the result.
Include skipped signals and exposure constraints; capital is not unlimited.
Compare several sensible parameter sets rather than promoting one optimum.
Judge return alongside drawdown, volatility, leverage and losing sequences.
Forward-test the unchanged rules before risking meaningful capital.
Explore the Trading Blueprint
The Financial Wisdom Trading Blueprint connects screening, chart structure, entry, initial risk and ongoing position management in one weekly process.

Frequently Asked Questions
What is a Darvas Box?
It is a consolidation bounded by identifiable support and resistance. In this test the box had to contain at least six completed weekly candles and remain within a maximum 20% range.
Does a breakout above the box trigger an immediate entry?
No. The weekly candle first had to close with the required clearance, close strength, volume and momentum conditions. Entry was then modelled 0.01% above the completed breakout close.
What does 1R mean?
One R is the original risk between entry and the initial protective stop. Expressing outcomes in R makes trades with different price levels and stop distances comparable.
Does the 412.8% result predict future returns?
No. It is a simulated historical outcome under a specific set of assumptions. Future market regimes, costs, execution and signal behaviour can produce materially different results.
Further Reading
About the Author
Written by Gareth, MBA
Gareth, founder of Financial Wisdom, has more than 30 years of personal trading experience. He develops the Financial Wisdom stock-screening and portfolio tools and documents the rules, evidence and limitations behind his trading process.
Educational information only. Trading and investing involve risk, including the possible loss of capital. Backtests are hypothetical, depend on their assumptions and are not guarantees of future performance. Nothing in this article is personalised financial advice.


Comments