
How to Swing Trade Stocks with the Best Swing Trading Strategies
- May 3, 2020
- 4 min read
Updated: Dec 31, 2025
Learn How to Swing Trade Stocks the Right Way
Swing trading is often described as the sweet spot between day trading and long-term investing. It combines technical analysis, fundamental filtering, and strict risk management to capture meaningful price moves over days to months—without the noise and stress of intraday trading.
The goal of a swing trader is simple:identify stocks in strong trends, take high-probability chunks of the move, then recycle capital into the next opportunity. A flat or sideways stock is an opportunity cost. Capital should always be working.
In this guide, we’ll walk through:
What swing trading really is
How professional swing traders think about entries, exits, and risk
Proven swing trading strategies (long and short)
Why risk management matters more than win rate
How combining fundamentals with technicals dramatically improves results

What Is Swing Trading?
Swing trading focuses on capturing the movement between a swing low and a swing high.
In an uptrend, the trader looks to buy after a pullback (a higher low) and sell after momentum weakens.
In a downtrend, the trader looks to sell short after a rally (a lower high) and cover as downside momentum fades.
The critical insight is this:
You do not need to catch the exact top or bottom. In fact, trying to do so usually destroys performance.
Professional swing traders deliberately miss part of the move in exchange for confirmation, structure, and controlled risk.
Pivot Points, Pullbacks, and Risk Control
Most swing trades are built around pivot points.
A pivot confirms that:
A temporary counter-trend move has ended
Price has resumed its primary trend
A logical stop-loss level exists

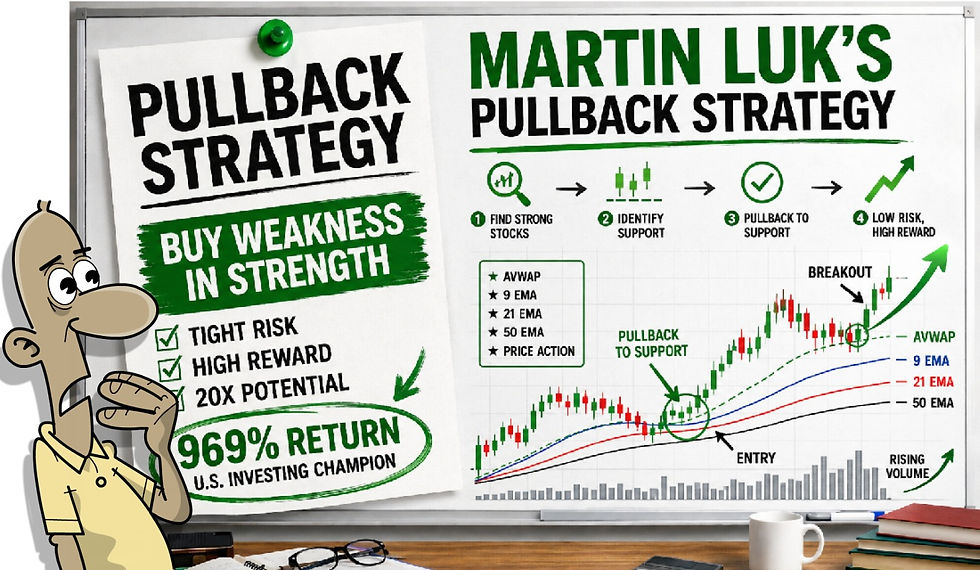
This is why phrases like “buying the pullback” or “buying the dip” are so common in swing trading. The dip isn’t random—it’s a structured pause within a trend.
Once a pivot forms:
The pivot low becomes support
A stop loss can be placed just below it
Risk is clearly defined before entry
Risk–Reward: The Foundation of Swing Trading
Every swing trade must start with risk, not profit.
A minimum 2:1 risk-to-reward ratio is widely accepted across all professional trading styles.
Example:
Entry: $10
Stop loss: $9
Risk: $1 per share (10%)
Minimum target: $12

If the trend continues and later shows signs of reversal, the trader exits—accepting that some upside is sacrificed in return for confirmation.
This mindset shift is essential:
Swing trading is not about perfection. It’s about repeatability.
Position Sizing and Account Risk
Brian Pezim, author of How to Swing Trade, recommends risking no more than 2% of account equity per trade.
Why this matters becomes obvious when we look at probabilities.
Assume:
Account size: $10,000
Risk per trade: 2% ($200)
Risk-reward: 2:1
Win rate: 50%
Monte Carlo simulations show:
Losing streaks of 10–13 trades are statistically normal
A 2% risk keeps drawdowns survivable
Higher risk quickly leads to equity damage or ruin

Risk control keeps you in the game long enough for probability to work.
Long and Short Swing Trading: Using Momentum Shifts
Swing traders don’t just trade bull markets. Stocks fall faster than they rise—often two to three times as fast.
“Bulls take the stairs up. Bears take the window down.”
One of the most effective tools for identifying momentum shifts is the MACD (Moving Average Convergence Divergence).
While no indicator is perfect, MACD helps:
Identify trend momentum
Signal when momentum is weakening
Provide structured exits

Long Example (Trend Continuation)
Price forms higher highs and higher lows
MACD crosses bullish
Stop placed below structural support
Exit when momentum turns
Short Example (Trend Reversal)
Price loses trend structure
MACD crosses bearish
Stop placed above recent high
Cover as downside momentum fades
Combining long and short trades allows capital growth across different market regimes.
High-Probability Swing Trading Patterns
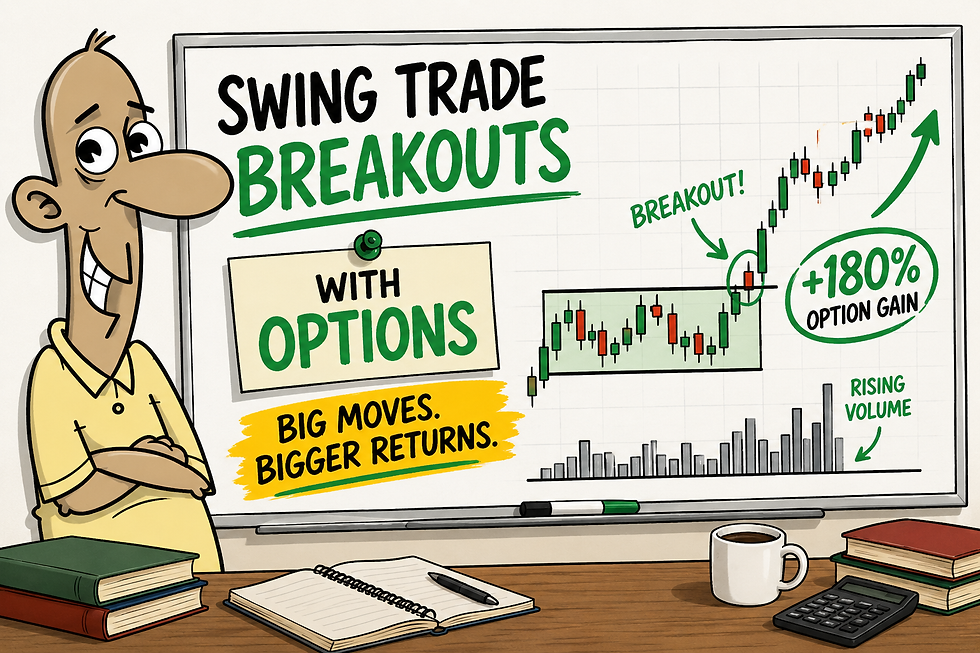
Bull Flag (Continuation Pattern)

One of the most reliable swing setups is the Bull Flag.
Characteristics:
Research shows:
~67% success rate
Clear stop placement
Predictable risk-reward structure
When paired with a 2:1 risk-reward ratio, the math becomes compelling—even without a high win rate.
The same logic applies to Bear Flags in downtrends.

Why Fundamentals Improve Swing Trading Results
Technical setups work best when applied to the right stocks.
Filtering by quality, value, and momentum dramatically improves outcomes.
This is where factor-based screening becomes powerful.
Using tools like Stockopedia’s StockRank (Quality + Value + Momentum):
Eliminates low-quality companies
Avoids deteriorating trends
Focuses attention on institutional favourites
Historically, portfolios built from top-ranked stocks have significantly outperformed market indices.

This philosophy underpins our own approach:
Quality first
Momentum confirmation
Technical execution
Strict risk management
Key Principles of a Professional Swing Trading Strategy
Combine fundamentals and technicals
Accept missing part of the move
Focus on risk before reward
Use confirmation, not prediction
Never risk more than 2% per trade
Trade both long and short
Let probability, not emotion, drive decisions

Final Thoughts
Swing trading is one of the most capital-efficient and scalable ways to trade stocks.
When executed with discipline, structure, and probability:
You don’t need to be right often
You don’t need to trade constantly
You don’t need to predict the market
You only need a repeatable edge and the discipline to execute it.
Key Takeaways
Swing trading captures trends over days to months
Risk management matters more than win rate
Confirmation beats prediction
Technical patterns work best on quality stocks
Long and short trades smooth equity growth
FAQs
Is swing trading suitable for beginners?Yes—provided risk is controlled and expectations are realistic.
How long do swing trades last?Typically a few days to several months, depending on trend strength.
Do I need to short stocks?Not mandatory, but shorting improves performance during weak markets.
Is MACD enough on its own?No. Indicators support decisions—price and risk come first.
How many trades should I take?Fewer, higher-quality trades outperform frequent low-quality ones.
Published by FinancialWisdomTVRules-Based Breakout Trading | Quality & Momentum | Probability-Driven Execution

Comments